
Though a long-time critic of journal impact factors (JIFs), I was delighted when the latest batch was released by Clarivate last week.
It’s not the JIFs themselves that I was glad to see (still alas quoted to a ridiculous level of precision). Rather it was the fact that Clarivate is now also making available the journal citation distributions on which they are based. This is a huge boost to the proposal made a couple of years ago by myself, Vincent Larivière and several prominent editors and publishers that citation distributions should be published by journals that advertise their JIFs.
Our proposal aimed to reduce the persistent and highly toxic influence of the unidimensional JIF on research assessment by giving authors and readers had a much richer picture of the real variation of citation performance within any given journal. It depended for its impact on journals following the recipe we provided in our preprint for generating the distributions from proprietary citation data in Web of Science or Scopus. Although a number of enlightened editors were quick to adopt the practice (e.g. at PNAS, Acta Cryst. A), it did not spread as far or as rapidly as we woudl have wished. However, now that the distributions are available ready-made from Clarivate*, there is no reason for any journal not to follow suit.

I hope that many will now opt to do so. Bianca Kramer (aka @MsPhelps) was quick off the mark publishing a couple of examples of citation distributions from well-known journals (see above). The enormous range of citation performance is immediately apparent.
Commendably, Clarivate have gone further and disaggregated research papers from reviews and other article types in the distributions. This is something the San Francisco Declaration on Research Assessment has long called for (see point 14 in the text of the declaration); it helps to further untangle the complexity underlying the JIF. Helpfully, Clarivate also now separately report the median citation rates of primary research articles and reviews. This reveals how highly-cited reviews inflate the indicator.
So I congratulate Clarivate on a positive move that provides the information needed for more responsible use of quantitative publication indicators. Of course, the goal of establishing robust research assessment processes that are free of the JIF has yet to be achieved. We need all journals that make any mention of their JIFs to also show Clarivate’s citation distributions. And we need researchers and research managers to start internalizing what they mean.
Even then there will be more to do. For one, Elsevier has recently made a big move into journal metrics with the publication of CiteScore, its alternative to the JIF; I hope that they too will start making the underlying citation distributions available.
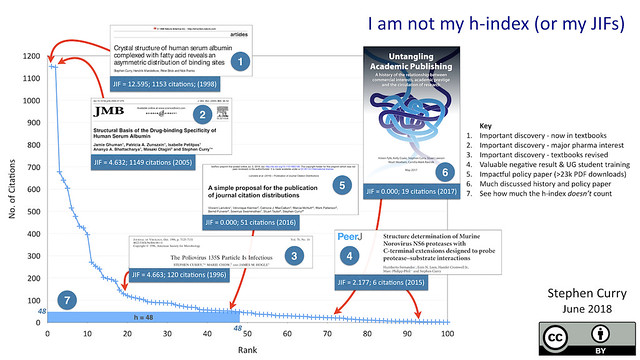
Then there is the residual problem of that other unidimensional indicator, the h-index. In my view, any researcher who quotes their h-index should be expected to also show the underlying citation distribution. I have done this myself recently (using data gathered manually from Google Scholar – see above) as a way of showing that there are interesting and impactful stories to tell about my research papers irrespective of where they appear on the citation distribution.
Numbers are too powerful sometimes. In assessing any complex human activity like research, it is the stories, the narratives that provide the context essential to making an informed judgement.
*Important note about the use of Clarivate’s citation distributions: The initial press release didn’t mention the re-use rights are for the plots that subscribers can now find on Web of Science but Clarivate’s Marie McVeigh has now clarified this officially in the comment below. She confirms that journals can indeed publish these distributions (with attribution).
**For those familiar with R, Steve Royle has published a clever script that makes it easy to grab and h-index citation data from Google Scholar.


Officially, for Clarivate Analytics:
Use of the Citation Histograms is subject to the same terms and conditions as use of any other data point in Journal Citation Reports. The terms of business for JCR are included here: https://clarivate.com/terms-of-business
specifically: https://cdn.clarivate.com/wp-content/uploads/2018/02/product-terms_EN.pdf
We ask, of course, that you correctly attribute the source of the graph(s) as: 2017 Citation distribution graph from Journal Citation Reports (Clarivate Analytics 2018). This also supports the validation of the graph in the product.
Downloadable images are in the works.
The shorter version is: “Clarivate does not permit the reproduction or redistribution of substantive sections of the JCR product: for example, it is not acceptable to re-publish a complete category with titles and metrics. Publishers may use metric values, including rank in category, and the citation distribution graphs associated with an individual journal both for internal management purposes and on the journal’s website (subject to attribution as noted).”